
Are you trying to master the art of creating Infographics in PowerPoint? Then you’ve landed in just the right spot! In this 5-minute read, we’ll uncover the secrets of crafting engaging infographics in PowerPoint, explore various infographic styles, and share effective tips for seamless data presentation that leaves a lasting impact on the audience. So, let’s dive in!
Table of Contents
What Is an Infographic PowerPoint, and Why Use It?
An infographic PowerPoint refers to a presentation created using the Microsoft PowerPoint software. Infographics are visual representations of information designed to present complex information quickly and clearly. In a PowerPoint presentation, infographics can be used to enhance the audience’s visual appeal, engagement, and understanding.
Key features of an infographic PowerPoint presentation typically include the following:
- Visual elements such as graphs, icons, charts, and images.
- Vibrant colors and visually appealing design.
- Icons and symbols.
- Minimal text.
Infographic PowerPoints are particularly practical for presenting complex data, statistics, processes, or comparisons in a way that is more engaging and memorable than traditional text-based presentations. They are widely used in business, education, and various professional settings to communicate information effectively.
Ever noticed how infographics make memes more comprehensible on social media? Infographics are your go-to tool for presenting information in a concise, easy-to-understand manner. Got some data or ideas? Converting them into an infographic is a breeze, especially with PowerPoint as your ally. Read on to find out how to make good infographics in PowerPoint.
Creating an Infographic in PowerPoint
These 8 simple steps will help you create compelling infographics in PowerPoint quickly and without much stress.
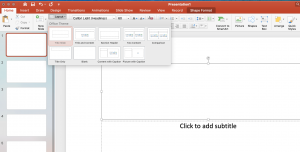
Step 1: Open a new presentation
To start crafting your infographic, first, tweak the PowerPoint slide size. To do so, navigate to the Design tab and select ’Slide Size.’ Once done, choose your desired height and width parameters from the menu and click OK.
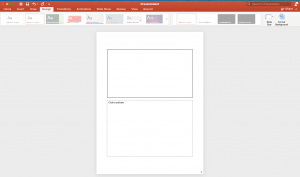
Step 2: Switch to portrait mode
When you’ve resized your slide, the next step is to transform it into portrait mode.
In the same tab, switch the orientation from landscape to portrait. Keep in mind that the ideal size for attractive infographics is 6 inches wide by 12 inches tall.
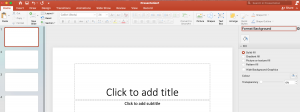
Step 3: Choose a background for your PowerPoint infographics
Next, select an appropriate background for your infographic. You can start with PowerPoint’s default white background, too.
To customize your background, right-click on the slide and select ’Format Background.’ Here, you can pick textures, patterns, colors, and gradients to suit your style.
Step 4: Add title and subheading
Now, it’s time to add a title and subheading for your infographics. These are the focal points of your infographic, so make them stand out! Alter the font and size in the default slide settings or choose a specific design from the Layout section.
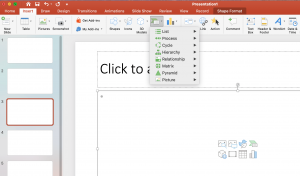
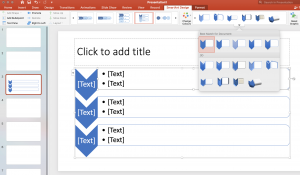
Step 5: Add SmartArt elements
Head to the Insert tab and look for ’SmartArt’ to bring in charts, shapes, and other visual elements. Pick from various graphics, then click OK and start filling the chosen graphic style with your data. You can also customize the colors of any SmartArt design to suit your brand.
Step 6: Insert text and data
The heart of your infographics PowerPoint presentation is its content, so ensure it’s of the highest quality.
Enter your text in the provided SmartArt boxes, adjusting size and shape as needed. To add content to the background, select ’Text Box’ from the Insert tab and place it where you need it. You can also explore the Insert tab’s ’Shapes’ tool for more text box and graphic design options.
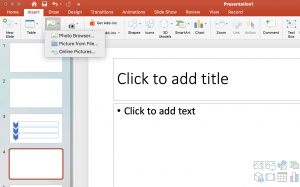
Step 7: Add visuals
What makes infographics truly effective? Visual elements, of course! Click’ Picture’ under the Insert tab to insert images into your PowerPoint infographic design. This option allows you to upload from your computer or search for relevant pictures online through PowerPoint.
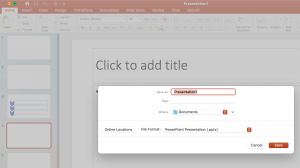
Step 8: Preview and save
After adding the final touches, it’s time to save your masterpiece. Go to File, then click ’Save As’ to store your infographic in the preferred format.
Note that in the infographic maker PowerPoint, you can choose between various formats, including PDF, or save your file as a template and go back to improve it at a later time.
4 Infographic Styles You Can Use to Enhance Your Presentation
- Timeline infographics: Ideal for presenting product evolutions, brand stories, or industry trends.
- Modern design infographics: These templates feature contemporary designs with a variety of banners, arrows, and column charts to choose from.
- Flowchart infographics: Great for depicting processes, project plans, or manufacturing sequences.
- Data-centric infographics: These templates mainly focus on numbers and use charts, graphs, and data visualizations to provide information.
Smart Tips for Infographic Design PowerPoint
Here are the top 8 tips to enhance your infographic design:
Tip #1: Maintain simplicity in your visuals to keep your audience engaged.
Tip #2: Enhance your infographic with unique design elements like icons, logos, and typefaces.
Tip #3: Use one standout color for crucial information to accentuate its importance.
Tip #4: Tell a story with your data and create a clear hierarchy in your information for a thoughtful and logical flow.
Tip #5: Use infographic tools for PowerPoint sparingly to maintain clarity and avoid overwhelming your audience with excessive visual elements.
Tip #6: If your infographic is digital, add clickable tabs, hyperlinks, and subtle animations for enhanced interactivity.
Tip #7: Make sure to use alt text for images and maintain high contrast for text and background to make your infographic accessible to people with visual impairments.
Tip #8: Seek inspiration from existing infographics online, and don’t hesitate to opt for pitch deck design help from professional services to ensure a polished and impactful representation of your ideas.
By incorporating these tips, your PowerPoint design will not only be visually appealing but also effective in communicating your message. Remember, a great infographic is a balance of aesthetics, clarity, and storytelling.
Final Thoughts
Creating a compelling infographic in PowerPoint goes beyond just assembling data and images. It’s more about crafting a visual narrative that speaks to your audience in a language they understand and appreciate.
If you’re new to PowerPoint and want to avoid risking your brand’s image, consider guidance from corporate presentation services like SlidePeak. With a wealth of expertise in presentation design, our dedicated team can create visually compelling infographics that not only convey information with style and clarity but also enhance your brand’s aesthetics.
Feel free to contact us for a free consultation and quote at any time of the day or night. We’re online 24/7 to discuss your specific needs and bring them to life!