
If you work in a company that generates money, financial presentation is a part of its reality. Finance professionals are responsible for organizing all performance data to display financial information to stakeholders and explain investments, revenue, or loss. Almost every week, these specialists present financial slides with PowerPoint crammed with numbers and lines of text.
If you are a financial professional, you would probably like not to deliberately torture your listeners. One way is to address our skilled people from a presentation design company since we know what your board members and executives expect and want. Another way is to find better ways of presenting reports that keep the attention and provide enough credible information. Therefore, let’s reflect on how your financial PowerPoint presentation can drive your results.

Table of Contents
How to Present Financial Information?
Unfortunately, if people do not possess great experience or presentation skills, they create not compelling, not differentiated, and not professional presentations. They make typical mistakes like a sheet of text with no space or numbers that never end.
Consider the following recommendations to improve your PowerPoint financial presentation:
- Using PowerPoint slides is not the best format for lengthy statement use. You should use PowerPoint slides only to highlight key points.
- If some slides require detailed explanations, supplement them with a printed report.
- Show the data in discrete animated segments throughout the slide to deliver data in a clearer way.
- Give only one statement or statistics per slide.
- Use bars, graphs, and charts instead of countless numbers and percentages.
- Use maps together with animation to make the presentation of the sales data more visually appealing.
- Combine logos, images, text, and animated graphics evenly to keep the attention.
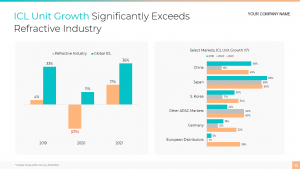
Here is a great example of a correct slide: one comprehensive statement per slide, use of bars, and animated data.
But the main advice is to imagine yourself in the chair of an executive, CEO, or board member. Does your presentation give confidence in the company’s financial achievements? Do you know what these numbers really mean? Do you understand what the slides are trying to say? Is this chart easy to grasp? Do these colors attract attention? And many more questions to ask yourself before presenting financial information. Make your credibility pop out properly!
Why is PowerPoint Good for Financial Presentation Slides?
PowerPoint slides are visually consistent
For example, to emphasize the consistency point, you can use one color palette for all slides and one font family throughout the whole presentation. It helps viewers to move from one slide to another with less resistance. It refers to techniques that display text and slide transitions between presentation sections.
Here is an example of a visually attractive slide with one color palette to help the audience perceive better.
The more, the merrier is not a good approach
If you’ve seen financial presentation examples in ppt, you might notice that good ones are simple, straightforward, and clear in their message. PowerPoint provides a lot of visual opportunities, but it also invites you to be frugal in the use of animations and other motion graphics. The slide has boundaries, and you’d notice that you overdid.
Take a maximum of charts
Bars, graphs, and charts are underestimated elements of PowerPoint. Some of them are hard to create, but practice makes perfect. Besides, use typical pie charts along with, e.g., non-traditional cascade charts to impress people. If you look for something unusual, google slides design to find skillful and proficient assistance.

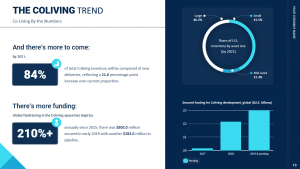
Here is an example of simple chart usage, but it still looks more attractive than writing pure numbers everybody hates.
How to Present a Financial Report or Types Financial Presentation
Financial Investor Presentation
Investors and lenders always have a lot of opportunities to invest. It means you have to create a PowerPoint presentation on finance that stands out and captivates both their attention and capital. They’re looking at projects day in and day out, so you need to do your best to fit into their portfolio.
So, we know they are looking for something unique and compelling to differentiate their portfolio. But how to make your presentation the one and the only?
- Start the draft with the table of contents and define the audience.
- Remember that every slide must answer the “Why you?” question.
- Avoid wordy and bland slides that make people indeed bored.
- Avoid extensive Excel spreadsheets and transform them into more attractive and easier-to-understand graphs.
- Create a branded presentation look that will resonate with investors.
- Create “Why?” slides with key highlights and answer them: Why this region? Why invest here? Why now?
- Every slide must give investors confidence in your company or startup’s success and credibility.
- Talk about the things you really know and spend time learning them to answer possible additional questions after the presentation.
- Investors are smart people, but everyone likes stories more than dry financial facts.
80% of what investors are looking at is bland, so make sure you are in the top echelon to get a desirable investment.
Presentation on Financial Planning
If your company plans to raise more money, connect with new partners, or invest in smaller headquarters, it needs a financial plan to avoid losing money or getting into debt. Thus, financial professionals are invited to analyze the current situation and propose a solution accompanied by attractive PowerPoint slides.
- Presentation slides for finance planning include many numbers. So, your task is to resolve questions like “What is this slide about?”.
- It is your task to guide people to where you want them to look. Do you want them to go from left to right or vice versa? Make sure you decide before the actual presentation.
- When telling about financial planning numbers, you need to give your subsequent opinion to preceded questions like “How is it going to impact our business decisions?”.
- The financial plan must include the client’s objectives and financial situation, your analysis, proposed strategies/solutions, and the implementation plan schedule.

Despite many numbers on the slide, the table is constructed well, and it doesn’t even need additional explanation.
Balance Sheet
A balance sheet is the bigger picture of a business that takes into account all assets and liabilities. You should add it to the main presentation.
However, the balance sheet is not an impactful display of financial data, and it doesn’t make it easy to grasp a quick picture of the company. Even if you’re good at using PowerPoint presenter features like a laser pointer or highlighter, it’s still challenging to deliver a clear message about the company’s finances.
We advise the next steps to create comprehensive balance sheet slides:
- Dissect the report into small pieces that are easier to assimilate.
- Use those parts to build an overview for the audience that sees it first.
- Follow the overview with additional analysis in one or more slides.
- Use bars, graphs, and charts for income statements.
- Avoid adding a lot of text with more explanatory comments.
- Speak additional explanations with references to information in the slide.
Since they are located in neighboring financial realities, you can use these recommendations for the balance sheet, cash flow statements, or income statements.
Why Does It Matter to Present Financial Data to Your Executives Effectively?
For most presenters (beginners especially), executives look like dark and super strict people who do not know what they want. Meanwhile, they just want to know, e.g., the company’s revenue, debt size, number of investments in the previous month, etc. Commonly, they get bored or angry if your presentation complicates everything and just wastes their time.
To begin with, walk yourself through these questions to present effectively:
- What information is needed?
- What will it be used for?
- Who will see the information?
- How does it need to be presented?
- What does my audience expect from me or this presentation?
Presenting data can be intimidating if you do not understand what people want from you. You should always ask for clear instructions or expectations to deliver the needed information. If you want satisfied executives, you should tell a financial story by splitting your slides and describing all charts with words and some analysis that simplifies every number.
Conclusion
Your next financial presentation can be a career booster. Or, it can be just a lost opportunity to showcase your knowledge and skills. If you consider the information presented above, you have more chances to rise above the crowd due to presenting financial data in visually compelling ways. If you can’t, you could remain stuck in the mosh pit. However, if you use non-traditional forms of presenting financial reports, you increase credibility and positively impact the company’s strategy and your career perspectives.