
Reports accompany and shape decisions at all organizational levels, from work groups and local businesses to national policy-making associations. Analytical reports in PowerPoint are a common form of technical and engaging communication, specifically in the workplace. Typically, analytical reports respond to research questions, either “how many sales we made in February?” or “what is the total profit from online shop sales?”.
While the presentation design agency takes care of your slides, you need to work on the method to collect and analyze numbers. Let’s look in detail at analytical report writing specifics and the benefit you can take from designing it.
Table of Contents
What is an Analytical Report?
An analytical report is used to solve a business problem. While a simple informational report contains only facts and data with no solution (annual report, monthly financial report, etc.), an analytical report with an attractive analytical report design provides a meaningful analysis of collected information and offers recommendations for solving a case. Some examples of analytical reports include science research, feasibility report, tracking website landing page conversions, etc.
An analysis in the analytical report is based on quantitative and qualitative data collected from specific business metrics. It helps to estimate a business strategy and gives employees the authority to make data-driven decisions based on analysis and evidence.
What is the Difference Between a Simple Report and Analytical Report?
Reporting and analytics as terms are often used interchangeably, but they are actually two different forms of business intelligence and serve distinct purposes.
Report:
Reporting is the process of organizing data in the form of summaries. To make a report look less boring, people use charts and graphs, but the keyword here is summary.
Analytical Report:
Analytics is a process of exploring data to extract meaningful insights to better understand and improve business processes. While the regular report just says where things might be wrong, an analytical document states what things are wrong.
Benefits of Analytical Report
The effective report analysis is key for intelligent business development. There is no sense in decisions that are not overviewed and not estimated. Working with analytics will make you more competitive and empower your decisions. There are 3 main benefits of an analytical report:
- Transformation: constant progress is a must in the digital world, and the analytical report can be used as a forecast to keep up with changes/trends, refine business models, and lead a thriving company.
- Innovation: as a modern business tool, analytical report presentation gives a dynamic data visualization to analyze strengths and weaknesses, detect patterns, and share them with all departments to make them informed and innovative.
- Awareness: when people do not know what result their activity brings, they can work less motivated and focus on their personal revenue, not the company’s one.
How to Write an Analytical Report?
The analytical report will be based on a lot of numbers. Even though it does not always look as pretty and colorful as a simple report, one thing, in particular, makes analytics so special. And it is data pivoting you should develop to write an insightful analytical report.
Let us explain it with an example.
A standard report is usually something like a graph that plots your sales on an axis. The graph is built from flat data, which is OK. But if you want to dig deeper to see what sales are really made of, it represents too much data to overview (literally zillions of rows).
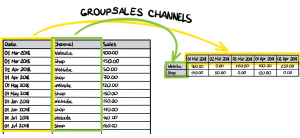
Pivoting a report means transforming your flat data into 2 dimensions.
- You take all the dates, get all distinct values, and put them onto the axis.
- You take all selling channels (website, offline shop, etc.), group them, and put them on another axis.
- You end up with the grid where each cell is the sum of sales that happened on a specific date on the specific sales channel.
How to Do an Analytical Report?
Beyond just pivoting the data, analytics means the data is actually stored and viewed in a multidimensional form. The best way to picture it is to think of it as a cube: channel, product, and time sides. Whereas each cell stands for selling a specific product on a specific sales channel on a particular day. Importantly, each cell should represent a distinct measure of business performance: sales, profits, expenses, budget, forecast, etc.
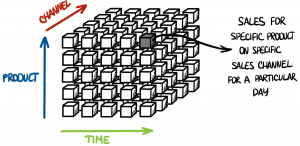
Having data in this form gives you limitless possibilities to explore, question patterns, create calculations across multiple dimensions, and drill down into granular data. Or whatever you need to do to gain valuable insight into your business to make data-driven and analysis-based decisions.
Why is presenting data an important thing? Our answer.
How to Make a Cover Design for an Analytical Report?
If you create a presentation yourself, it is a place to turn your creativity on. The presentation design, first and foremost, depends on the type of your organization, whether a financial establishment or an art studio. Thus, you should use strict cold colors or bright warm ones accordingly for your cover.
If you feel you are good with information but need one more brain to design and present numbers creatively, make sure to contact professional pitch deck design services.
Important Slides to Include in Analytical Report PowerPoint Presentation
A typical analytical report must follow the IMRaD pattern. This pattern follows the steps of the scientific method and includes the following sections (slides):
- Introduction.
- Method (the one we described above).
- Results (answers to research questions, insights).
- Discussion.
You should definitely adapt the recommended slides to meet the needs of your specific project or research question. For example, you may choose to include a conclusion or recommendations.
Follow this link to find out how to present financial information not boring.
Summary
You should use analytical reports to respond to a research question and get valuable recommendations for your specific field and purpose. Thus, an analytical report will provide not raw data but customized and flexible answers. With the report, you easily observe sales trends, revenue over time, or revenue peaks during the weekends or holidays. The last thing left is to design it attractively to present an engaging presentation to colleagues.
You are welcome to contact our services to get a presentation that achieves your goals. Contact us and get a free consultation on your case!